Qinghai Profile
Featured Industry
Tourism
Economy
The industry of the province includes mining, chemical, electric power, leather processing and wool-spinning with agriculture, hydropower, salt-making, nonferrous minerals, petroleum and natural gas as its pillar industries. Animal husbandry is based on breeding of sheep, yak and horses. Agriculture products include wheat and Qingke. The fishery industry of Qinghai Lake and Zhalin Lake is of fairly large scale. In 2008, Qinghai’s GDP totaled RMB 97 billion, ranking 30th in the country. The population of permanent residents in Qinghai is 5.543 million, with a per capita GDP of RMB 17,509.
Major Economic Indicators
| Economic Indicators | 2007 | Jan - Sep 2008 | ||
|---|---|---|---|---|
| Value | Growth (%, y-o-y) | Value | Growth (%, y-o-y) | |
| Gross Domestic Product (RMB bn) | 78.4 | 12.5 1 | 68.4 | 13.2 1 |
| Per Capita GDP | 14,257 | 11.7 1 | ||
| Added Value Output | ||||
| - Primary industry (RMB bn) | 8.3 | 4.4 1 | 6.2 | 3.5 1 |
| - Secondary industry (RMB bn) | 41.8 | 14.9 1 | 39.1 | 18.8 1 |
| - Tertiary industry (RMB bn) | 28.2 | 11.7 1 | 23.1 | 8.0 1 |
| Value-added Industrial Output 2 (RMB bn) | 31.5 | 22.7 1 | 15.6 4 | 23.5 1 |
| Fixed-assets Investment (RMB bn) | 48.7 | 16.2 | 15.7 4 | 19.1 |
| Retail Sales (RMB bn) | 20.8 | 15.7 | 17.9 | 21.2 |
| Inflation (Consumer Price Index, %) | 6.6 | 12.4 4 | ||
| Exports (US$ mn) | 385.9 | -27.8 | 264.7 3 | 8.4 |
| - By FIEs (US$ mn) | 16.4 | 42.8 | 35.8 3 | 778.8 |
| Imports (US$ mn) | 226.2 | 92.4 | 172.3 3 | 37.1 |
| - By FIEs (US$ mn) | 94.2 | 171.4 | 132.4 3 | 198.7 |
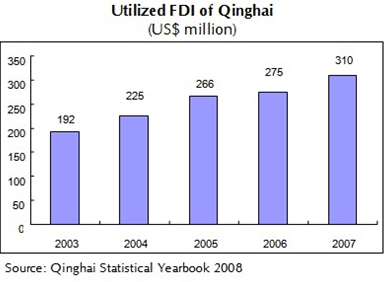
| Utilized Foreign Direct Investment (US$ mn) | 310.0 | 12.7 | - | - |
Notes: 1 In real terms 2 For all state-owned enterprises and other forms with annual sales over RMB 5 million 3 Jan-Aug 2008 4 Jan-May 2008.
Industries
Qinghai is a large province in resources such as pastoral resource, hydropower resource, mineral resources, saline resources, petroleum & gas resources. The natural resources endowment has a great influence on shaping the industry structure of Qinghai.
Composition of GDP (%)
| 2000 | 2007 | |
|---|---|---|
| Primary | 30.9 | 10.6 |
| Secondary | 23 | 53.3 |
| Industry | 8.6 | 44.0 |
| Tertiary | 46.2 | 36.1 |
Value-added Share of Pillar Industries (2007)
| % share of industrial value-added | |
|---|---|
| Petroleum & natural gas industries | 26.7 |
| Nonferrous metal industry | 26.2 |
| Saline chemical industry | 16.0 |
| Hydropower generating industry | 12.8 |
Foreign Trade & Foreign Investment
Major export items included aluminum & rolled aluminum, silicon, yarn, woolen fiber, etc. Major export markets included Japan, the US and Korea. Major imports were aluminum oxide, Medical instruments and equipment, Cars and car chassis, etc.
In 2007, foreign investments in Qinghai were mainly engaged in manufacturing industries (40.1% of the contracted amount), production of electricity, gas and water. Hong Kong is the biggest source of FDI in Qinghai, accounting for 59.2% of the province's contracted FDI in 2007, followed by the US (19%) and Virgin Islands (16.5%).

FDI in Qinghai
| 1991-2007 | 2007 | |
|---|---|---|
| No. of contracts | 491 | 37 |
| Contracted amount (US$ mn) | 2,562.3 | 416.0 |
| Utilised amount (US$ mn) | 1,526.3 | 310.0 |
Digital Source: Qinghai Statistical Yearbook 2008, China's customs statistics 8.2008

 Inquiry Basket (

